

Image Details
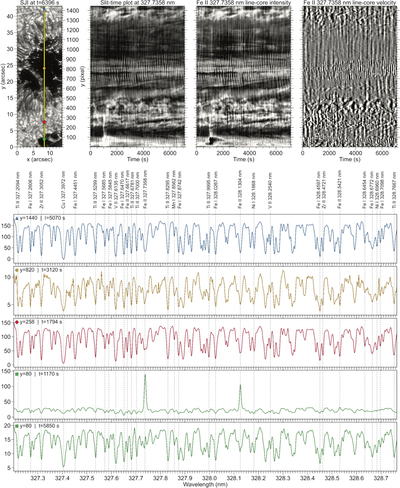
Caption: Figure 1.
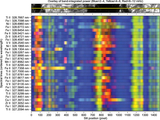
Context for the active region transect and spectral variability along the SUSI slit. Top left: SJI with the analyzed transect overplotted; colored markers indicate the locations used for the example spectra. Remaining top-row panels (left to right): slit–time diagrams for Fe II 327.7358 nm showing (i) intensity at a fixed wavelength sample near the atlas wavelength, (ii) fitted line-core intensity, and (iii) fitted line-core LOS velocity, displayed as an illustration of the LOS velocity amplitude. Bottom row: five example spectra at the marked locations, shown as relative intensity (arbitrary units) and lightly smoothed for readability (visualization only). Vertical lines indicate the analyzed spectral lines.
Other Images in This Article
Copyright and Terms & Conditions
© 2026. The Author(s). Published by the American Astronomical Society.

