

Image Details
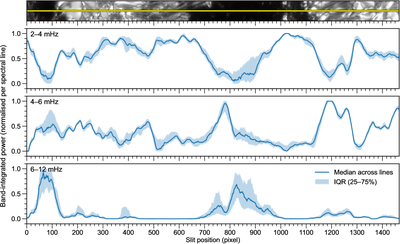
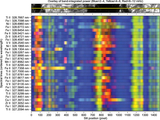
Caption: Figure 3.
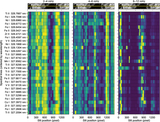
Robust ensemble summary of the line-resolved band-integrated maps in Figure 2. For each frequency band, the solid curve shows the median of the row-normalized band power across the 30 lines as a function of slit position, and the shaded region shows the interquartile range (25th–75th percentiles). The SJI strip above these panels provides the same spatial context as in Figure 2.
Other Images in This Article
Copyright and Terms & Conditions
© 2026. The Author(s). Published by the American Astronomical Society.

Copyright ©
2026 Astronomy Image Explorer. All Rights Reserved.
