

Image Details
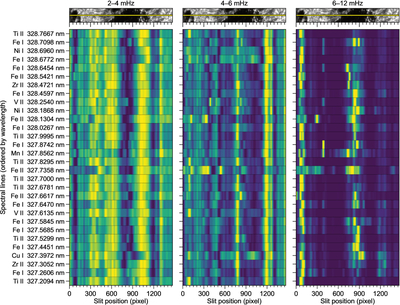
Caption: Figure 2.
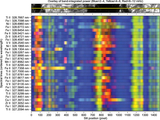
Stacked, line-resolved band-integrated RGWS power along the slit for three frequency ranges (left to right): 2–4 mHz, 4–6 mHz, and 6–12 mHz. Rows correspond to the 30 selected spectral line diagnostics (ordered by increasing wavelength). Each row is normalized to its own maximum along the slit, so the color scale highlights where along the slit each line concentrates power within the given band rather than comparing absolute power between different lines. A slit-jaw context strip above each panel marks the slit position and facilitates identification of umbra, penumbra, plage, and pore segments.
Other Images in This Article
Copyright and Terms & Conditions
© 2026. The Author(s). Published by the American Astronomical Society.

Copyright ©
2026 Astronomy Image Explorer. All Rights Reserved.
