

Image Details
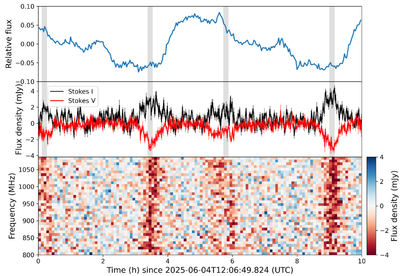
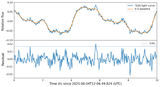
Caption: Figure 1.
Simultaneous ASKAP radio and TESS optical observations of ASKAP J181335−604720. Top panel: the TESS relative optical light curve during the ASKAP observing interval, with the flux normalized to the median value and expressed in fractional units. Middle panel: ASKAP radio light curves in Stokes I (black) and Stokes V (red), binned to 60 s for clarity. Bottom panel: dynamic spectrum of the ASKAP Stokes V radio emission, binned to 5 min in time and 8 MHz in frequency for clarity. The gray shaded regions indicate the epochs at which radio pulses are detected.
Other Images in This Article
Copyright and Terms & Conditions
© 2026. The Author(s). Published by the American Astronomical Society.

Copyright ©
2026 Astronomy Image Explorer. All Rights Reserved.
