

Image Details
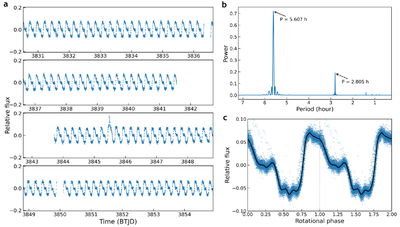
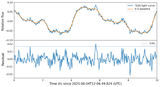
Caption: Figure 2.
TESS photometric analysis of ASKAP J181335−604720 (TIC 365466012). (a) Sector 93 TESS PDCSAP light curve after excluding cadences with nonzero QUALITY flags, shown in four consecutive time intervals for clarity. The flux has been normalized relative to its median value. (b) Lomb–Scargle periodogram of the Sector 93 light curve, computed over a total baseline of 24.39 days. A dominant peak is detected at a period of P = 5.607 ± 0.003 h, while a secondary peak at P = 2.805 hr, close to P/2, corresponds to the first harmonic of the rotational modulation. (c) TESS light curve phase-folded on the derived rotation period and repeated over phases 0–2 for visual clarity. Phase zero is defined by T0 = 3831.00474 BTJD (60830.50474 MJD), corresponding to the start time of the strictly simultaneous ASKAP observation. The black curve shows the median-binned modulation, and the vertical dashed line marks the boundary between the two repeated cycles.
Other Images in This Article
Copyright and Terms & Conditions
© 2026. The Author(s). Published by the American Astronomical Society.

