

Image Details
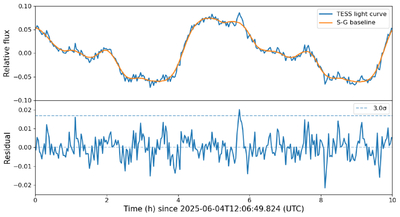
Caption: Figure A2.
Residual light curve after removal of rotational modulation. Top: the strictly simultaneous TESS light curve, shown as relative flux, during the 10 hr interval overlapping the ASKAP radio observations. The long-term trend is modeled using a Savitzky–Golay (S–G) filter (orange curve), with a window length of 60 minutes. Bottom: residual light curve obtained after subtracting the S–G baseline. The dashed horizontal line marks the 3σ threshold.
Other Images in This Article
Copyright and Terms & Conditions
© 2026. The Author(s). Published by the American Astronomical Society.

Copyright ©
2026 Astronomy Image Explorer. All Rights Reserved.
