Image Details
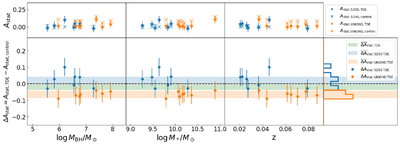
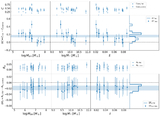
Caption: Figure 6.
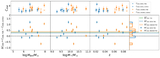
Asymmetry parameter analysis for TDE host galaxies and their control samples. The top panel presents the STATMORPH asymmetry parameter Astat for TDE host galaxies (star symbols) and their control samples (cross symbols) as a function of MBH, M*, and z. As in Figure 5, measurements are based on UNIONS images (orange symbols) when available, and SDSS images (blue symbols) otherwise. The control sample measurements were weighted-averaged over 500 samples and consistently derived from the same survey as their TDE host galaxy. The bottom panel displays the difference in the asymmetry parameter ΔAstat = Astat,TDE − Astat,control, with 1σ error bars. The shaded regions indicate the mean ΔAstat for the UNIONS (orange), SDSS (blue), and combined (green) subsets. A dashed line marks ΔAstat = 0. The rightmost panel provides a histogram of the ΔAstat distribution for these different samples. Overall, these results show that TDE host galaxies, especially the higher-resolution UNIONS sample, display no indication of enhanced asymmetry (and actually slightly reduced asymmetry) compared to their control sample.
Other Images in This Article
Copyright and Terms & Conditions
© 2026. The Author(s). Published by the American Astronomical Society.