Image Details
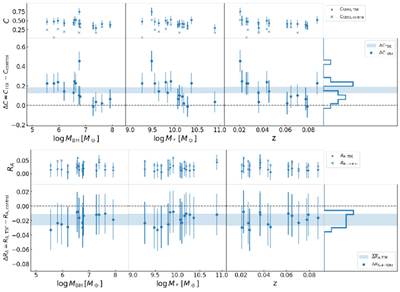
Caption: Figure C2.
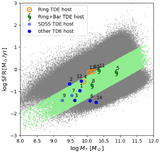
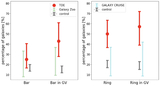
The same analysis in Section 3.2 on the concentration C (top) and residual asymmetry RA (bottom) from L. Simard et al. (2011). The symbols remain in the same style as in Figure 5. These measurements are done using SDSS images only, hence they are only in blue. Asymmetries are not enhanced (slightly suppressed) and concentrations are enhanced in TDE hosts relative to controls. These outcomes agree qualitatively with our results using STATMORPH measurements.
Other Images in This Article
Copyright and Terms & Conditions
© 2026. The Author(s). Published by the American Astronomical Society.
Copyright ©
2026 Astronomy Image Explorer. All Rights Reserved.