Image Details
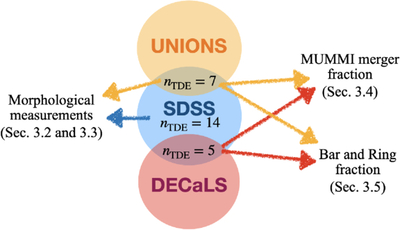
Caption: Figure 1.
Schematic diagram illustrating the overlap of the image catalogs used for various analyses. The central blue region represents the initial SDSS spectroscopic catalog (with a sample of 14 TDE host galaxies). Overlaid are the UNIONS (orange) and DECaLS (red) galaxies, showing their respective overlaps: seven of the SDSS TDE hosts are also present in UNIONS, and five are also found in DECaLS. The color-coded arrows indicate which image catalog was utilized for each specific analysis discussed in Section 3.
Other Images in This Article
Copyright and Terms & Conditions
© 2026. The Author(s). Published by the American Astronomical Society.
Copyright ©
2026 Astronomy Image Explorer. All Rights Reserved.