Image Details
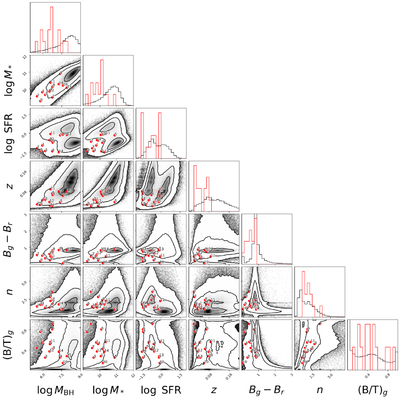
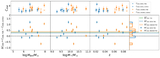
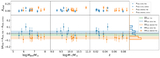
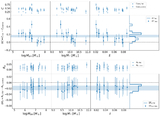
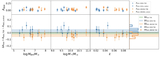
Caption: Figure 4.
Corner plots comparing parameter distributions of the general SDSS galaxy population (contours) and our TDE host galaxy sample (red circles). Each red circle marker is annotated with its corresponding index from Table 1. The parameters displayed (from left to right) are: BH mass MBH, stellar mass M*, SFR, redshift z, bulge color Bg − Br, Sérsic index n, and B/T ratio (B/T)g. The contours represent the 1σ, 2σ, and 3σ confidence levels of the SDSS galaxy distribution. These plots reveal that TDE hosts tend to have lower BH and stellar masses, reside at low redshifts, exhibit bluer bulge colors indicative of younger stellar populations, and possess intermediate structural properties such as Sérsic index and bulge dominance.
Other Images in This Article
Copyright and Terms & Conditions
© 2026. The Author(s). Published by the American Astronomical Society.