Image Details
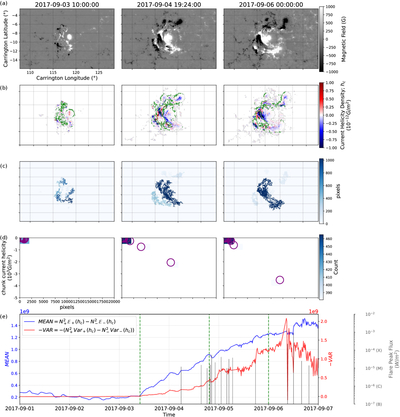
Caption: Figure 3.
Current helicity spatial distribution and chunk evolution for AR 12673. (a) Radial magnetic field at three time points (column titles). (b) Current helicity distribution at the same time points; green lines mark PILs. (c) Chunk masks (spatially coherent regions with consistent helicity sign) at the same time points; color intensity represents pixel count in each chunk; only chunks with dominant negative helicity are shown. (d) Chunk pixel count versus total helicity scatter plots with 2D histogram backgrounds. (e) MEAN term (red) and -VAR term (blue) evolution. Green dashed lines indicate column header times; black lines mark M-class and above flare peaks.
Other Images in This Article
Copyright and Terms & Conditions
© 2026. The Author(s). Published by the American Astronomical Society.