Image Details
Caption: Figure 2.
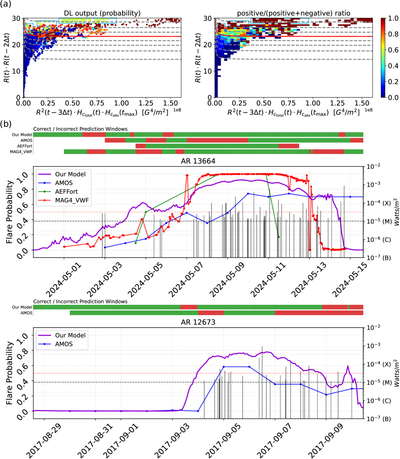
Representative SR model performance. Panel (a): plane spanned by the two terms in the representative model that correlate explicitly with flare probability, evaluated over the full dataset: x-axis ﹩{R}^{2}(t-3{\rm{\Delta }}t){H}_{{c}_{{\rm{total}}}}(t){H}_{{c}_{{\rm{abs}}}}({t}_{{\rm{\max }}})﹩, y-axis R(t − 2Δt)R(t). Left: calibrated probabilities from the deep learning model. Right: ratio of positive (flaring) to total samples in each bin. Panel (b): Forecasting examples for AR 13664 and AR 12673. For each AR, the horizontal strips above the time series plot summarize correct/incorrect prediction windows at a 0.5 threshold over the intervals where each model provides output (green: correct, red: incorrect). The lower plots show probability time series for the available models; purple lines denote our SR model, and black vertical segments mark observed M-class and above flares. Archived empirical models from the CCMC flare scoreboard (e.g., AMOS, AEFFort, MAG4) are included where available for each AR.
Other Images in This Article
Copyright and Terms & Conditions
© 2026. The Author(s). Published by the American Astronomical Society.