Image Details
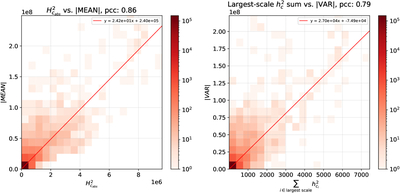
Caption: Figure 4.
High correlations for MEAN and VAR terms, computed from all 1744 HARPs in our dataset. 2D histograms with linear fits (red). Left: squared absolute net helicity (﹩{H}_{{c}_{{\rm{abs}}}}^{2}﹩) versus absolute MEAN (r = 0.87). Right: sum of squared current helicity in the largest chunk versus absolute VAR (r = 0.79).
Other Images in This Article
Copyright and Terms & Conditions
© 2026. The Author(s). Published by the American Astronomical Society.
Copyright ©
2026 Astronomy Image Explorer. All Rights Reserved.