Image Details
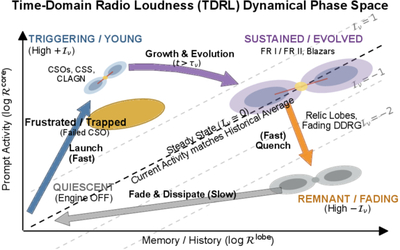
Caption: Figure 1.
The TDRL diagnostic plane. The vertical axis shows the prompt/core radio-loudness ﹩{R}_{\nu }^{{\rm{core}}}﹩, tracing present-day engine activity; the horizontal axis shows the memory/lobe radio-loudness ﹩{R}_{\nu }^{{\rm{lobe}}}﹩, tracing the time-integrated jet history over τν. The dashed diagonal marks approximate quasi-equilibrium between injection and accumulated lobe power; the perpendicular offset defines the mismatch index ﹩{{ \mathcal I }}_{\nu }﹩ (Equation (6)). Four regimes are indicated: triggering or restarting (core bright, lobe faint, ﹩{{ \mathcal I }}_{\nu }\gg 0﹩), sustained activity (both components bright, ﹩{{ \mathcal I }}_{\nu }\simeq 0﹩), remnant or fading (lobe bright, core faint, ﹩{{ \mathcal I }}_{\nu }\ll 0﹩), and quiescent or weak systems (both components faint). The two-dimensional decomposition separates what the engine is doing now from what it has done in the past, a distinction that scalar R cannot make. Orientation-dependent beaming of the core component can shift sources along the vertical axis and must be modeled or controlled for in quantitative applications.
Other Images in This Article
Copyright and Terms & Conditions
© 2026. The Author(s). Published by the American Astronomical Society.