

Image Details
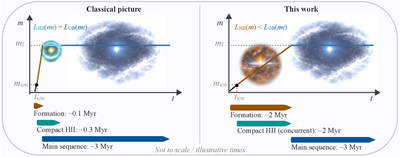
Caption: Figure 1.
Schematic illustration of the mass growth and luminosity mapping assumed in the classical interpretation of compact H II regions (left) and in the IIM picture explored in this work (right). In both panels the stellar mass m increases with time until it reaches the final mass mf, after which the star evolves on the main sequence (horizontal segment). Ionizing emission turns on when the growing star crosses the threshold mass mion at tion (dotted line, black dot). Classical picture: the formation phase is short, and the compact-H II stage is treated as a subsequent, comparatively brief phase of roughly fixed stellar mass, so that the embedded ionizing source is effectively already at mf and LH II(mf) = LOB(mf). This work: the compact-H II phase occurs during continued accretion; the ionized emission is produced while m < mf, implying LH II(m) < LOB(mf) and motivating a comparison between the compact-H II-region LF at luminosity L and the OB-star LF at higher luminosities corresponding to the eventual mf. The colored bars indicate the approximate timescales for our reference mf ≃ 60 M⊙ case inferred in this work; they are not to scale and are intended to illustrate the ordering of phases, highlighting that in the growth scenario the compact-H II-region phase is concurrent with the stellar mass assembly.
Other Images in This Article
Copyright and Terms & Conditions
© 2026. The Author(s). Published by the American Astronomical Society.

