

Image Details
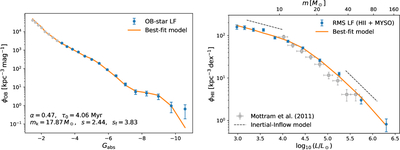
Caption: Figure 3.
Left: completeness-corrected OB-star LF from the ALS III catalog (blue circles with 1σ Poisson error bars), together with the global best-fit model from the joint 5D fit described in Section 5 (orange curve). The horizontal axis is the absolute Gaia magnitude Gabs, and the vertical axis is the number density per magnitude, ϕOB, in units of kpc−3 mag−1. The text in the lower-left corner reports the best-fit parameter values, corresponding to the lowest χ2 (they differ slightly from the posterior medians quoted in Figure 4 and in Sections 5.1 and 5.2). The light-gray points were excluded from the fit because the low-luminosity end of the LF is somewhat sensitive to the details of the completeness correction. Right: completeness-corrected LF of RMS embedded sources, including both compact H II regions and massive YSOs (blue circles with 1σ Poisson error bars), together with the prediction of the same best-fit model (orange curve). Open gray squares denote the LF from M11, and the black dashed lines indicate the analytic slopes predicted by the IIM in the low- and high-mass regimes, assuming a constant star formation rate and a stellar IMF with Salpeter’s slope at low masses. The lower horizontal axis gives the bolometric luminosity, while the upper axis gives the corresponding stellar mass. The figure demonstrates that the same broken power-law IMF, combined with the same massive-star growth law, reproduces simultaneously and accurately both the OB-star and embedded-source LFs.
Other Images in This Article
Copyright and Terms & Conditions
© 2026. The Author(s). Published by the American Astronomical Society.

