

Image Details
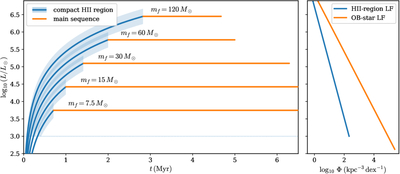
Caption: Figure 2.
Schematic mapping between stellar growth tracks in the luminosity–time plane and the observed LFs in the IIM. Left: example evolutionary tracks for stars of different final masses mf. During the growth phase (blue), the luminosity increases as the star accretes; once the ionization threshold is reached (dotted horizontal line at ﹩{\mathrm{log}}_{10}(L/{L}_{\odot })=3﹩), the source is counted as a compact H II region (blue shading) while it continues to brighten. After growth ends, the star enters the main-sequence phase (orange) at approximately fixed luminosity. Right: the compact-H II-region and OB-star LFs (shown here schematically) can be viewed as projections of the track distribution: the H II-region LF counts the time spent in each luminosity bin along the shaded portions of all tracks, so a single luminosity bin receives contributions from a range of mf; in contrast, the OB-star LF counts the main-sequence lifetime at the luminosity corresponding to the final mass. This figure is intended purely to illustrate the geometric origin of the LF construction in the model (not to provide a quantitative fit).
Other Images in This Article
Copyright and Terms & Conditions
© 2026. The Author(s). Published by the American Astronomical Society.

