

Image Details
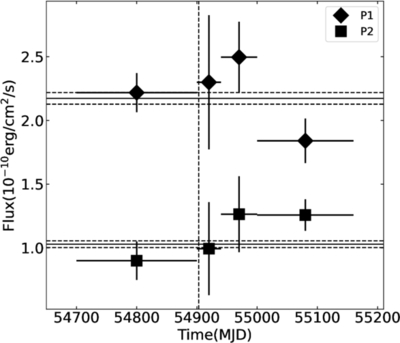
Caption: Figure 3.
The flux of the two pulse peaks. The diamond and square points represent the flux of P1 and P2, respectively. The black vertical dashed lines represent the occurrence time of the glitch. The horizontal solid line at 2.17 and 1.02 are the mean fluxes of P1 and P2, and the dashed lines represent their 1σ range.
Other Images in This Article
Copyright and Terms & Conditions
© 2026. The Author(s). Published by the American Astronomical Society.

Copyright ©
2026 Astronomy Image Explorer. All Rights Reserved.
