

Image Details
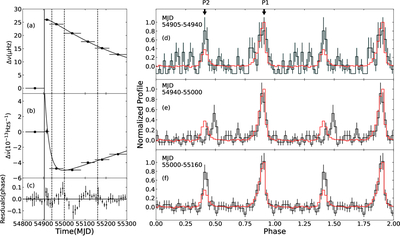
Caption: Figure 1.
The left panel shows the timing results for the glitch at MJD 54904. Panels (a) and (b) show the residuals of ν and ﹩\dot{\nu }﹩ of partial-timing results that subtract the preglitch spin-down trend, respectively. The solid lines represent the glitch model listed in Table 1. Panel (c) displays the TOA residuals fitted with the glitch model listed in Table 1. The right panel shows short-term variations in the pulse profile, and the vertical dashed lines in the left panel mark their epochs. Panels (d), (e), and (f) show the three successive pulse profile variations during MJD 54905–54940, MJD 54940–55000, and MJD 55000–55160, respectively. The black profile represents the short-term pulse profile, and the red profile represents the template profile accumulated from full data.
Other Images in This Article
Copyright and Terms & Conditions
© 2026. The Author(s). Published by the American Astronomical Society.

