

Image Details
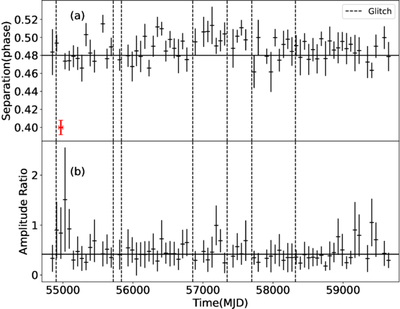
Caption: Figure 2.
Pulse peak separation and amplitude ratio measured in 60 day intervals. Panel (a) shows the peak separation, and panel (b) shows the amplitude ratio. Vertical dashed lines mark glitch epochs. A significant anomaly (highlighted in red) appears near the glitch at MJD 54904, with no notable variations detected at other glitch epochs or during other intervals.
Other Images in This Article
Copyright and Terms & Conditions
© 2026. The Author(s). Published by the American Astronomical Society.

Copyright ©
2026 Astronomy Image Explorer. All Rights Reserved.
