Image Details
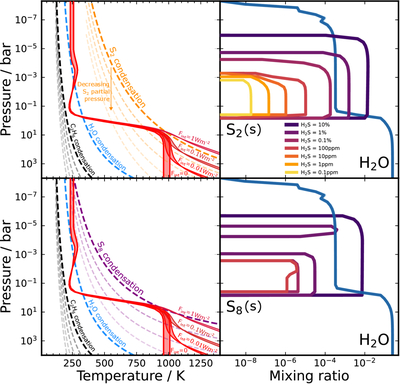
Caption: Figure 4.
(Left) The temperature structure of K2-18b across the range of input H2S abundances. The Antoine equations for the saturation vapor pressure of sulfur allotropes, H2O, and C2H6 are shown in bold dashed lines, and in lighter colored lines the vapor pressure curves are progressively scaled down from 100% to 100 ppm to illustrate how sulfur allotropes still condense out at trace mixing ratios. (Right) Profiles of gaseous H2O and condensed S2 and S8 in the atmosphere of K2-18b. For H2O we show only the profile for the 100 ppm H2S model, and the differences from the H2O condensation for the other models are insignificant.
Other Images in This Article
Copyright and Terms & Conditions
© 2026. The Author(s). Published by the American Astronomical Society.