Image Details
Caption: Figure 2.
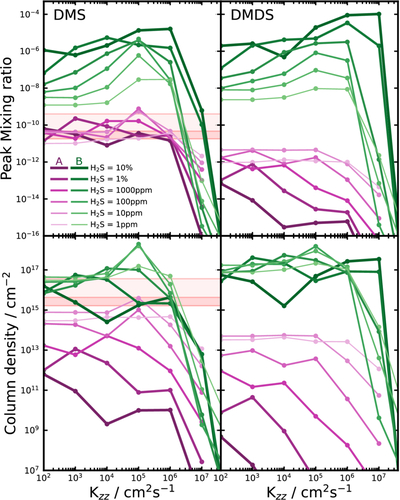
Maximum atmospheric volume mixing ratios (top) and integrated column number densities (bottom) of DMS (left) and DMDS (right) in a 1 bar H2 atmosphere containing 10% mole fraction of CH4 and varying H2S abundances. The results of pathway B are highlighted in green and those of pathway A in purple. A range of reference DMS mixing ratios observed over algae blooms on Earth are highlighted in red (K.-T. Park et al. 2017), along with their equivalent integrated column density assuming uniform mixing ratio.
Other Images in This Article
Copyright and Terms & Conditions
© 2026. The Author(s). Published by the American Astronomical Society.
Copyright ©
2026 Astronomy Image Explorer. All Rights Reserved.