Image Details
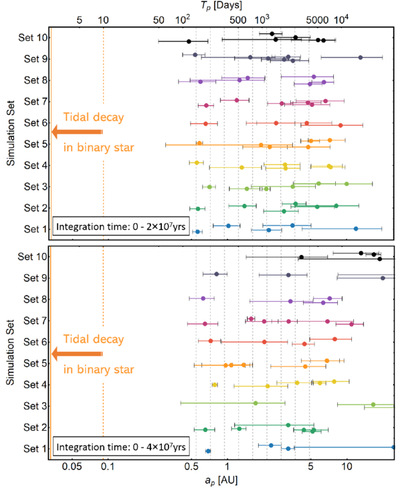
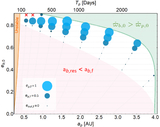
Caption: Figure 6.
Architecture of planetary orbits after the tidal evolution of the host binary has ceased. The results are based on statistical outcomes from 10 runs of the system depicted in Figure 5, each with a random initial value of the longitude of pericenter ϖp,0. Note that the results in Figure 5 correspond to “Set 6” here. For each set of numerical integration, the color-coded circles denote the semimajor axes (or orbital periods in days) of the survived planets. The horizontal line associated with each circle spans the corresponding periastron and apastron distances, indicating the orbital extent due to nonzero eccentricity. The gray vertical dashed line marks the initial semimajor axes of the nine planets. The orange vertical dashed line indicates the initial semimajor axis of the stellar binary ab,0, while the orange vertical solid line shows the binary separation after it has circularized. The results in the upper and lower panels correspond to different integration times, as labeled.
Other Images in This Article
Copyright and Terms & Conditions
© 2026. The Author(s). Published by the American Astronomical Society.