Image Details
Caption: Figure 4.
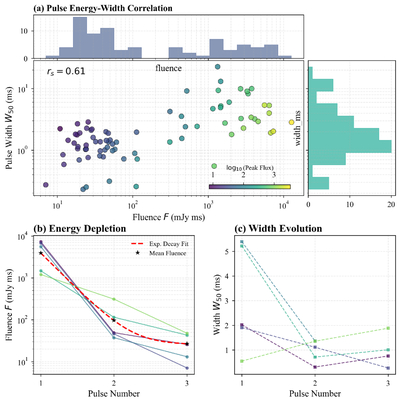
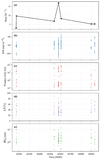
Energy-width dynamics and temporal evolution of single pulses from J2237+2828. (a) Joint distribution of pulse fluence (F) and width (W50), with points color-coded by peak flux density. The strong correlation (rs = 0.61) links high-energy giant pulses to broader emission profiles. Marginal histograms show the projected distributions. (b) Fluence evolution within consecutive burst sequences (length ≥3). The sequences reveal an “ignition-depletion” trend, well-fitted by an exponential decay (red dashed line) where the energy drops by nearly two orders of magnitude after the initial giant pulse. (c) Evolution of pulse width for the same sequences, showing a contraction from broad to narrow profiles, consistent with the depletion of the magnetospheric acceleration gap.
Other Images in This Article
Copyright and Terms & Conditions
© 2026. The Author(s). Published by the American Astronomical Society.