Image Details
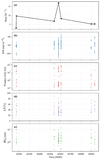
Caption: Figure 1.
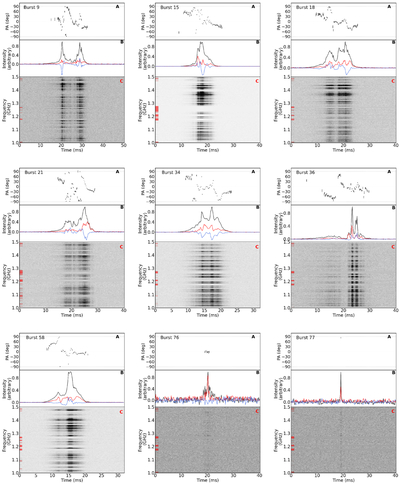
Polarimetric profiles and dynamic spectra of RRAT J2237+2828. In each panel set, the subplots from top to bottom are (a) PA profile; (b) pulse profiles showing total intensity (Stokes I, black), linear polarization (L, red), and circular polarization (Stokes V, blue); and (c) the dynamic spectrum. In panel (c), the horizontal red lines indicate specific frequency channels that have been excised to mitigate RFI.
Other Images in This Article
Copyright and Terms & Conditions
© 2026. The Author(s). Published by the American Astronomical Society.
Copyright ©
2026 Astronomy Image Explorer. All Rights Reserved.