Image Details
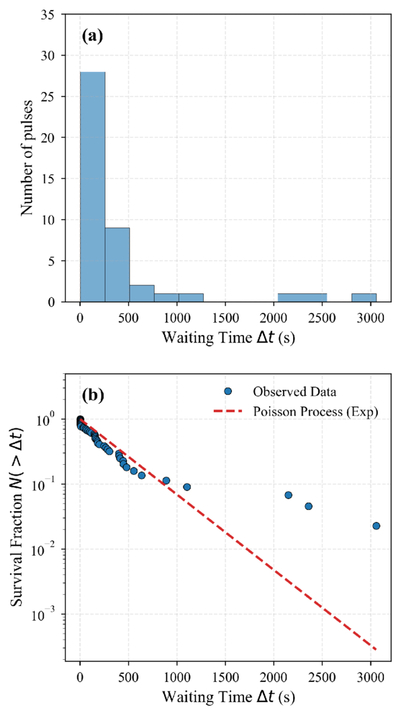
Caption: Figure 2.
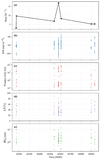
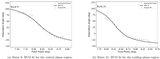
Temporal statistics of the waiting times between single pulses for J2237+2828. (a) Histogram of the observed waiting times (Δt), excluding consecutive burst detections (Δt < 1.5P0). The distribution reveals a significant population of long quiescent intervals extending up to ∼3057.71 s. (b) The survival function N(>Δt) plotted on a semi-logarithmic scale. The red dashed line represents the theoretical expectation for a memory-less Poisson process (exponential decay). The observed data (blue circles) deviates significantly from the straight line, exhibiting a heavy tail at long timescales. This deviation indicates that the burst occurrence is non-Poissonian and suggests a physical process involving long-timescale magnetospheric recovery or energy accumulation.
Other Images in This Article
Copyright and Terms & Conditions
© 2026. The Author(s). Published by the American Astronomical Society.