Image Details
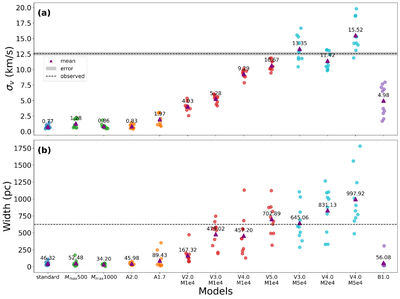
Caption: Figure 2.
(a) The measured σv values for each model using 10 subsamples. (b) The measured width values for each model using 10 subsamples. The colors indicate different groups of models. The purple triangles indicate the average σv and width of the subsamples. The black dashed line represents the observed σv and width reference, while the gray region represents the error of the observed σv.
Other Images in This Article
Copyright and Terms & Conditions
© 2026. The Author(s). Published by the American Astronomical Society.
Copyright ©
2026 Astronomy Image Explorer. All Rights Reserved.