Image Details
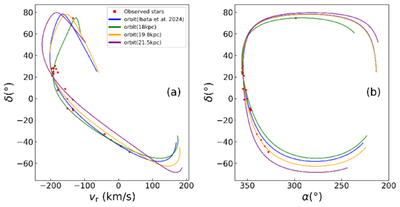
Caption: Figure A1.
The simulation of orbit. (a) The orbit in the (vr,δ) space. The red dots mark the observed stars. The blue line represents Ibata’s orbit, while the green, black, and purple lines represent the orbits of the stream at distances of 18 kpc, 19.8 kpc, and 21.5 kpc, respectively. (b) Spatial distribution of the orbit. As shown in the figure, the orbits exhibit different bending trends in the α–δ and (vr,δ) spaces as the distance increases. Considering these factors, we adopt the orbit at a distance of 19.8 kpc as the anchor orbit.
Other Images in This Article
Copyright and Terms & Conditions
© 2026. The Author(s). Published by the American Astronomical Society.
Copyright ©
2026 Astronomy Image Explorer. All Rights Reserved.