Image Details
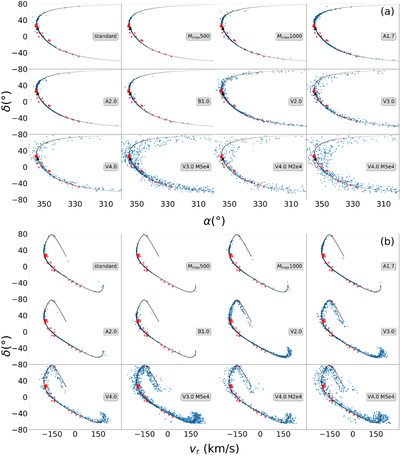
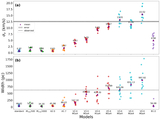
Caption: Figure 1.
(a) Spatial distribution of stars in the C-19 stream. (b) vr versus δ for C-19 stars. Each panel shows a different simulation model. The blue dots indicate the selected stellar used for comparison with observations, the red dots mark the observed stars, the black dots denote the orbit, and the black triangles represent the present-day position of the stream’s centroid.
Other Images in This Article
Copyright and Terms & Conditions
© 2026. The Author(s). Published by the American Astronomical Society.
Copyright ©
2026 Astronomy Image Explorer. All Rights Reserved.