Image Details
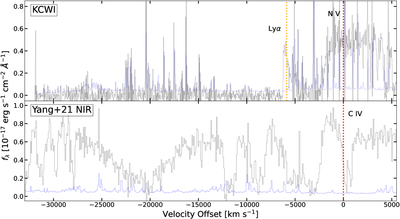
Caption: Figure 5.
Top panel: total flux spectrum (black) and the 1σ error spectrum (blue) extracted from the 2D mask, plotted as a function of velocity offset from N V. The orange dotted line marks the velocity offset of the Lyα centroid with respect to N V. Bottom panel: total flux spectrum (black) and the 1σ error spectrum (blue) of the NIR spectrum from J. Yang et al. (2021), plotted as a function from velocity offset from C IV. Values for the velocity range were chosen to cover the absorption line complex blueward of C IV. The red dotted line denotes the zero velocity offset, from N V (top panel) or C IV (bottom panel).
Other Images in This Article
Copyright and Terms & Conditions
© 2026. The Author(s). Published by the American Astronomical Society.