Image Details
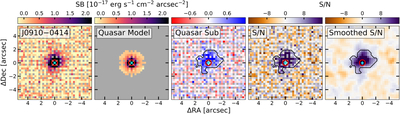
Caption: Figure 1.
Data, Quasar point source model, quasar-subtracted, S/N, and smoothed S/N cubes of J0910−0414, as described in Section 3. The images in each panel were formed by collapsing each cube over the spectral range where extended Lyα is detected (i.e., from ﹩{\lambda }_{{\rm{\min }}}﹩ to ﹩{\lambda }_{{\rm{\max }}}﹩). Gray pixels mark spaxels where no flux from the detector pixels was assigned when creating the cubes. The cyan star denotes location of the quasar, determined from the peak emission in a continuum white light image, and the red circle encloses the pixels that were used to scale the PSF model. The black contours in the quasar-subtracted, S/N, and smoothed S/N plots outline the 2D spatial mask described in Section 3. Surface brightness values for the three leftmost panels have not been corrected for cosmological dimming or extinction. In all panels, north is up and east is toward the left.
Other Images in This Article
Copyright and Terms & Conditions
© 2026. The Author(s). Published by the American Astronomical Society.