Image Details
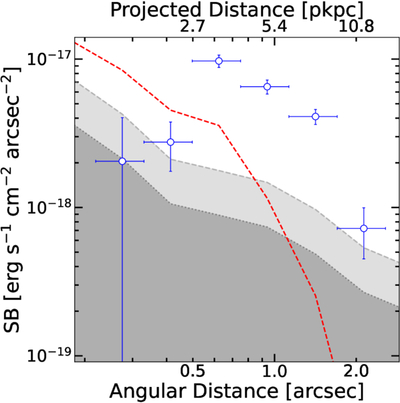
Caption: Figure 3.
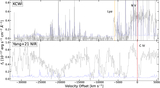
Radial surface brightness profile of the extended emission (blue points). The radial bins are logarithmically spaced, with the horizontal error bars spanning an entire bin. The shaded gray regions represent the 1σ (dark gray) and 2σ (light gray) noise levels measured over 9750–9780 Å. The PSF profile (FWHM = 1﹩\mathop{.}\limits^{^{\prime\prime} }﹩0) is plotted as a red dashed line.
Other Images in This Article
Copyright and Terms & Conditions
© 2026. The Author(s). Published by the American Astronomical Society.
Copyright ©
2026 Astronomy Image Explorer. All Rights Reserved.