Image Details
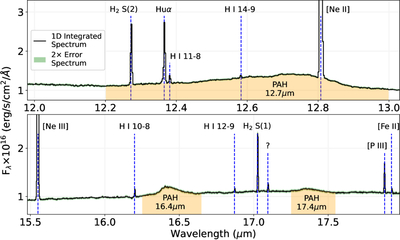
Caption: Figure 2.
Extracted rest-frame, 1D MIR spectrum of M33+46−380 (see Figure 1). The top and bottom panels correspond to the band A and C observations, respectively. The measured flux is plotted in black with green shading corresponding to the error spectrum (scaled by a factor of 2 for visibility). Emission lines are denoted with blue dashed lines, and we highlight PAH features in orange. The Huα, [Ne II]λ12.81 μm, and [Ne III]λ15.56 μm emission lines are detected at high S/N, enabling the robust measurement of Ne23 in individual H II regions.
Other Images in This Article
Copyright and Terms & Conditions
© 2026. The Author(s). Published by the American Astronomical Society.
Copyright ©
2026 Astronomy Image Explorer. All Rights Reserved.