Image Details
Caption: Figure 3.
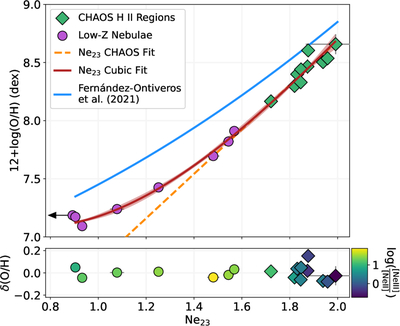
Direct 12+log(O/H) vs. Ne23 measured in the CHAOS H II regions (green diamonds) and low-Z nebulae (purple circles, upper limit represented with a black arrow). In most cases, the uncertainties on the points are smaller than the sizes of the symbols. The linear relation derived from the CHAOS H II regions is plotted as a dashed orange line, which describes the O/H–Ne23 trends at 12+log(O/H) ≳ 7.69 dex (10% solar O/H). A cubic function (solid red) accurately fits O/H at all Ne23, and the red shaded area represents the 16th and 84th percentiles of the resampled fit. The cubic function is offset ∼0.2 dex lower than photoionization model predictions (solid blue; J. A. Fernández-Ontiveros et al. 2021). The lower panel plots the difference between the measured and predicted 12+log(O/H), where the standard deviation is 0.06 dex. Each point is color coded by the [Ne III]/[Ne II] ratio, and no correlation between this ionization tracer and δ(O/H) is detected. These data reveal that Ne23 is a strong predictor of metallicity over 1.5 dex in 12+log(O/H).
Other Images in This Article
Copyright and Terms & Conditions
© 2026. The Author(s). Published by the American Astronomical Society.