Image Details
Caption: Figure 1.
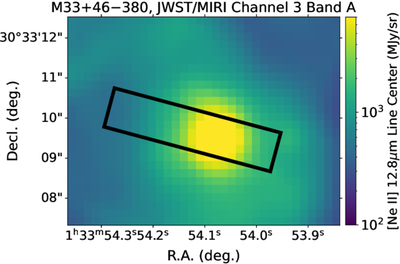
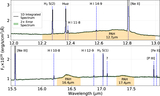
Ch3 band A data cube of the CHAOS H II region M33+46−380. The spectral map is plotted at the wavelength slice corresponding to the [Ne II]λ12.81 μm line center. In black, we plot the long slit aperture used to acquire the optical spectrum and measure Te and 12+log(O/H). We extract a 1D MIR spectrum (Figure 2) from an aperture matched to the optical observations, a necessary step to empirically calibrate the Ne23 diagnostic.
Other Images in This Article
Copyright and Terms & Conditions
© 2026. The Author(s). Published by the American Astronomical Society.
Copyright ©
2026 Astronomy Image Explorer. All Rights Reserved.