Image Details
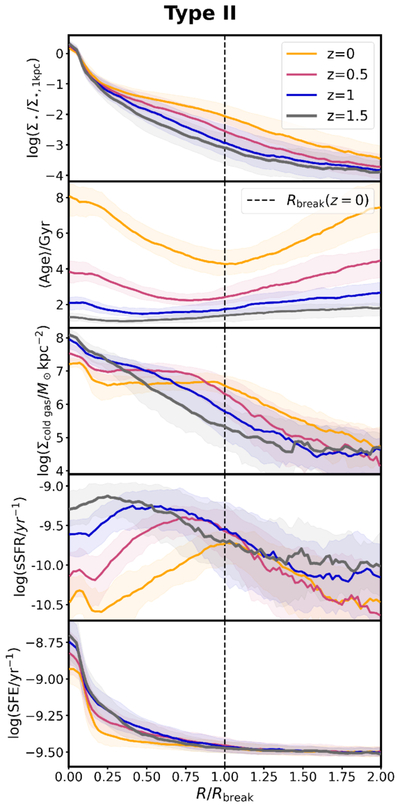
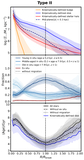
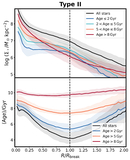
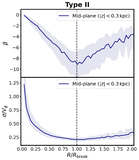
Caption: Figure 4.
Evolution of radial profiles for type II disk galaxies from z = 1.5 to z = 0, plotted against the normalized radius R/Rbreak. The panels represent, from top to bottom: normalized stellar surface density (Σ⋆/Σ⋆,1kpc), mass-weighted mean stellar age computed from all stellar particles within a cylindrical radius of R ≤ 30 kpc, cold gas surface density (Σcold gas), specific star formation rate (sSFR), and star formation efficiency (SFE). Colored curves correspond to different redshifts: z = 0 (yellow), z = 0.5 (pink), z = 1.0 (blue), and z = 1.5 (gray). Solid lines denote the median values, while shaded regions indicate the interquartile range (25th–75th percentiles). The vertical dashed line marks the break radius identified at z = 0.
Other Images in This Article
Copyright and Terms & Conditions
© 2026. The Author(s). Published by the American Astronomical Society.