Image Details
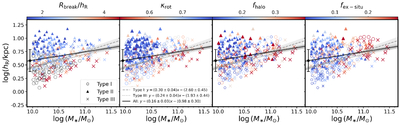
Caption: Figure 2.
Kinematic and structural properties of type I (circles), type II (triangles), and type III (crosses) galaxies in the hR–M⋆ plane. From left to right, the data points are color-coded by the ratio of break radius to inner disk scale length Rbreak/hR, rotational support κrot, stellar halo mass fraction fhalo, and ex situ stellar mass fraction fex-situ. In each panel, the symbol size scales with the corresponding color-coded quantity. The gray dashed, gray dotted, and black solid lines represent the linear fits to the hR–M⋆ relation for type I, type III, and the total disk sample, respectively; shaded regions denote the 1σ fitting uncertainties. The error bars indicate the standard deviation of the residuals from the global linear fit.
Other Images in This Article
Copyright and Terms & Conditions
© 2026. The Author(s). Published by the American Astronomical Society.