

Image Details
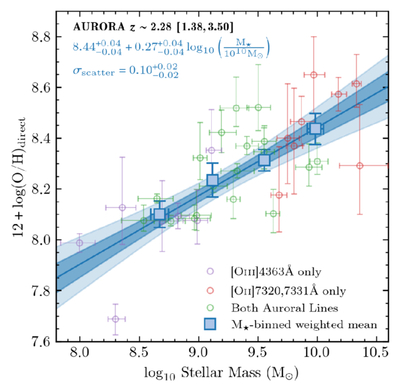
Caption: Figure 2.
Mass–metallicity relation for AURORA galaxies at z ∼ 2.3 using only direct Te metallicities. Open circles show individual galaxies color-coded based on whether [O III]4363 Å-only, [O II]7320,7331 Å-only, or both oxygen auroral lines were detected. Our best-fit model (blue solid line) is shown along with the best-fit parameters, and the darker (lighter) shading corresponds to the 1σ (2σ) confidence regions. Weighted mean values for equally populated stellar mass bins are shown for visualization purposes but not used in fitting.
Other Images in This Article
Copyright and Terms & Conditions
© 2026. The Author(s). Published by the American Astronomical Society.

Copyright ©
2026 Astronomy Image Explorer. All Rights Reserved.
