Image Details
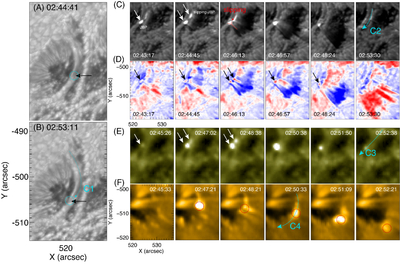
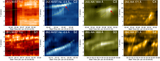
Caption: Figure 2.
(A)–(F) Zoomed-in snapshots showing the evolution of an LB jet from 02:41 UT to 02:50 UT in NVST TiO, Hα -0.6 Å , AIA 1600 Å , 171Å images, and Doppler proxy maps. The black arrows and the cyan circles in panels (A) and (B) denote a horizontal motion front along the light bridge. The white and black arrows in panel (C)–(E) point out the bright footpoints at the base of the LB jet. The red circle marks the bright plasma moving along the leading edge of the LB jet. The dashed cyan arrows in panels (B), (C), (E), and (F) denote the slit position used for the time–distance plot shown in Figures 5(A1)–(A4). NVST Hα line wing images (panels (C)) and the AIA 1600 Å and 171 Å (panels (E) and (F)) are shown in the animation.
(An animation of this figure is available in the online article.)
(An animation of this figure is available.)
The video/animation of this figure is available in the online journal.
Other Images in This Article
Copyright and Terms & Conditions
© 2026. The Author(s). Published by the American Astronomical Society.