Image Details
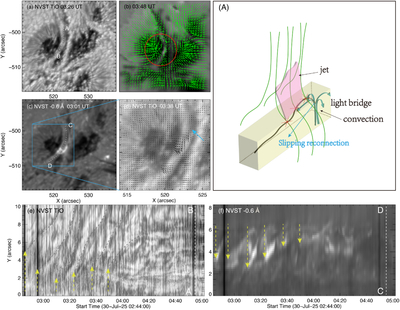
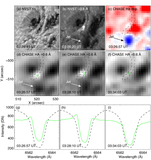
Caption: Figure 6.
(a) NVST TiO image at 03:26 UT. (b) The SDO/HMI vector magnetogram at 03:48 UT. Green arrows represent the strength and direction of the transverse magnetic fields. The boundaries between the sunspot and the LB are highlighted by a red circle. (c) NVST Hα off-band at 03:01 UT. (d) The field of view in panel (d) corresponds to the cyan box indicated in panel (c), showing the photospheric flow fields derived via the optical flow method from NVST TiO images. (e)–(f) Time–distance diagrams along the slices AB and CD shown in panels (a) and (b). The yellow arrows point to the six horizontal motion and the JBPs. (A) Schematic depiction of the slipping processes of the LB jet originating from an LB. Cyan arrows illustrate the diverging convective flows toward the LB. Green lines denote the ambient magnetic field lines anchored in the surrounding umbral region. The dark line signifies a horizontal magnetic field line being transported by the convective flow. Red star symbols mark the sites of slipping magnetic reconnection between the transported horizontal flux and the umbral field, which triggers the LB jets (pink shaded area); the slipping motion of the jet is indicated by the blue arrow.
Other Images in This Article
Copyright and Terms & Conditions
© 2026. The Author(s). Published by the American Astronomical Society.