Image Details
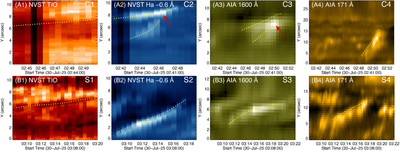
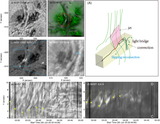
Caption: Figure 5.
Time–distance map along slices C1–C4 and S1–S4 shown in Figures 2 and 3. Panels (A1) and (B1) show the horizontal motion in the LB at different times. Panels (A2), (B2), (A3), and (B3) show the slipping bright footpoints in the LB for the different images of NVST Hα off-band and AIA 1600 Å . The red arrows in panels (A2) and (A3) mark the merged position between a bright patch and a slipping bright footpoint. Panels (A4) and (B4) display the moving plasma at the leading edge of the LB jets in the AIA 171 Å channel.
Other Images in This Article
Copyright and Terms & Conditions
© 2026. The Author(s). Published by the American Astronomical Society.
Copyright ©
2026 Astronomy Image Explorer. All Rights Reserved.