Image Details
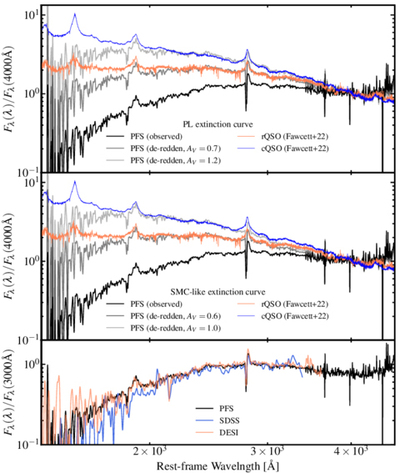
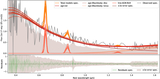
Caption: Figure 4.
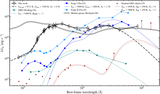
Top: comparison of the spectrum for BBQSORS with the median spectra of typical cQSOs and of rQSOs suffering moderate dust reddening (V. A. Fawcett et al. 2022), where all spectra are normalized at 4000 Å. We deredden the PFS spectrum assuming a PL dust extinction curve with AV = 0.7 and AV = 1.2. Middle: the same as the top panel, while the dereddening adopts an SMC-like extinction curve. Although the dereddened PFS spectrum has similar spectral shapes with cQSOs and rQSOs from about 2200–4000 Å, there are large discrepancies at the blue end for both PL and SMC-like extinction curves. Lower: comparison of PFS, SDSS, and DESI spectra for BBQSORS, where all are normalized at 3000 Å.
Other Images in This Article
Copyright and Terms & Conditions
© 2026. The Author(s). Published by the American Astronomical Society.