Image Details
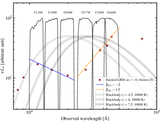
Caption: Figure 2.
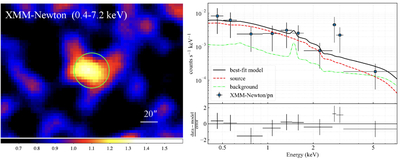
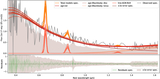
X-ray detection of BBQSORS with XMM-Newton. The left panel presents the EPIC/pn image in the 0.4–7.2 keV (rest frame ∼1–20 keV) band, detected at a significance of 3.42σ. The green circle indicates the source region with a radius of 20″. The right panel shows the EPIC/pn spectrum folded with the energy response (blue squares) and the best-fitting model (black curve), consisting of source and background components. Residuals between the data and the model are shown in the bottom panel.
Other Images in This Article
Copyright and Terms & Conditions
© 2026. The Author(s). Published by the American Astronomical Society.
Copyright ©
2026 Astronomy Image Explorer. All Rights Reserved.