Image Details
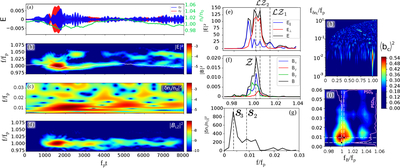
Caption: Figure 5.
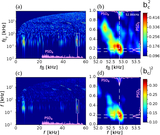
Waveform recorded by a virtual satellite moving into a 2D PIC simulation plane with the velocity ∣vs∣ = 0.1vT, in the direction opposite to B0. Plasma and beam parameters are ﹩{\rm{\Delta }}N=0.025﹩, fc/fp = 0.02, and vb = 0.25c. (a) Waveforms of the parallel ﹩{E}_{\parallel }={E}_{x}﹩ (blue) and perpendicular ﹩{E}_{\perp }\simeq {E}_{y}﹩ (red) electric fields (Ez is negligibly small). The green line represents the normalized ion density ni/n0 (right axis). (b) Spectrograms of the electric energy ∣E(f, t)∣2 = ∣Ex(f, t)∣2 + ∣Ey(f, t)∣2 + ∣Ez(f, t)∣2 in the frequency range of 0.97 ≤ f/fp ≤ 1.08; the white line represents the local plasma frequency fpl normalized to the average plasma frequency fp. (c) Spectrogram of ∣δni(f, t)/n0∣2 in the range of 0.005 ≤ f/fp ≤ 0.035. (d) Spectrogram of ﹩{\left|{{\boldsymbol{B}}}_{{ \mathcal L }{ \mathcal Z }}({\boldsymbol{f}},{\boldsymbol{t}})\right|}^{2}﹩in the same frequency range as (b). (e) Power spectra of the electric field energy ∣E(f)∣2 (black), in the range of 0.97 ≤ f/fp ≤ 1.04; the parallel and perpendicular energies are shown in blue and red, respectively. (f) Power spectra of the magnetic field energy ∣B(f)∣2 (black), in the same frequency range as (e); the three field components are indicated in color. (e), (f) Spectra are calculated in the time interval of 500 ≤ fpt ≤ 4000. (g) Low-frequency power spectrum ∣δni(f)/n0∣2 in the range of f/fp ≤ 0.03. (e), (g) Vertical dashed lines indicate the frequencies f3 ≃ 0.999fp, f2 ≃ 1.004fp and f1 ≃ 1.012fp (e), (f) as well as ﹩{f}_{3}^{{\prime} }\simeq 0.004{f}_{p}﹩ and ﹩{f}_{2}^{{\prime} }\simeq 0.009{f}_{p}﹩ (g). (h), (i) Square of the cross-bicoherence averaged on the 4 triads (Bx, δni, Ex), (By, δni, Ex), (Bx, δni, Ey), and (By, δni, Ey), in the ranges of fB/fp ≤ 1.1 and ﹩{f}_{\delta {n}_{i}}﹩/fp ≤ 1 (h), as well as 0.97 ≤ fB/fp ≤ 1.06 and ﹩{f}_{\delta {n}_{i}}﹩/fp ≤ 0.06 (i). Black dots indicate the position of the average cross-bicoherence ﹩\langle {b}_{c}\rangle \simeq 0.73﹩ and ﹩\langle {b}_{c}\rangle \simeq 0.65﹩ obtained for the decay processes ﹩{{ \mathcal L }{ \mathcal Z }}_{1}\longrightarrow {{ \mathcal L }{ \mathcal Z }}_{2}+{{ \mathcal S }}_{2}﹩ and ﹩{{ \mathcal L }{ \mathcal Z }}_{2}\longrightarrow { \mathcal Z }+{{ \mathcal S }}_{3}﹩, respectively.
Other Images in This Article
Copyright and Terms & Conditions
© 2026. The Author(s). Published by the American Astronomical Society.