Image Details
Caption: Figure 2.
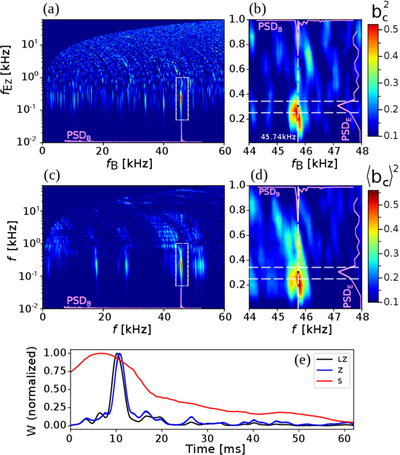
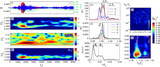
Determination of phase coherence between waves using cross-bicoherence. (a) Square of the cross-bicoherence, ﹩{b}_{c}^{2}({f}_{B},{f}_{{E}_{z}})﹩, computed with the field triad (B, Ez, B) over the time interval of 0 ≤ t ≤ 62 ms (see Equation (1) and the text), in the frequency ranges of﹩{f}_{B},{f}_{{E}_{z}}\,\leqslant \,60﹩ kHz. (b) Zoom-in of (a) in the map region with 44 ≤ fB ≤ 48 kHz and ﹩{f}_{{E}_{z}}\,\leqslant \,1﹩ kHz, where bc ≃ 0.7 at ﹩({f}_{B},{f}_{{E}_{z}})=({f}_{{ \mathcal Z }},{f}_{{ \mathcal S }})\simeq (45.74,0.3)﹩ kHz (black dot). (c) Square of the cross-bicoherence averaged on 18 different triads with Ez or Ey in the second position, ﹩{\langle {b}_{c}\rangle }^{2}﹩, in the same frequency range as (a). (d) Zoom-in of (c) in the same frequency range as in (b), with ﹩\langle {b}_{c}\rangle \simeq 0.7﹩ at ﹩({f}_{{ \mathcal Z }},{f}_{{ \mathcal S }})﹩ (black dot). (b), (d) The dashed white vertical lines indicate the local plasma frequency. The magenta curves represented on the upper and right borders of the panels reproduce the magnetic and low-frequency electric spectra (PSDB and PSDE) used to calculate bc, respectively (see Figures 1(h), (i)). (e) Variations with time of the ﹩{ \mathcal L }{ \mathcal Z }﹩, ﹩{ \mathcal Z }﹩, and ﹩{ \mathcal S }﹩ wave energies W (see the legend) obtained by integration of the wavelet spectrograms of the E, B, and E fields, respectively, in the range of 45.2 ≤ f ≤ 47.8 kHz for the ﹩{ \mathcal L }{ \mathcal Z }﹩ and ﹩{ \mathcal Z }﹩-mode waves, and f ≤ 0.4 kHz for the ﹩{ \mathcal S }﹩ waves.
Other Images in This Article
Copyright and Terms & Conditions
© 2026. The Author(s). Published by the American Astronomical Society.