Image Details
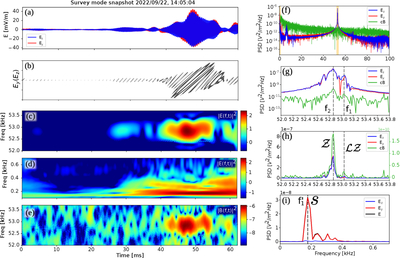
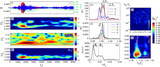
Caption: Figure 3.
Snapshot captured by RPW on 2022 September 22, at 14:05:04 UT. (a) Waveform of the two electric field components Ez (blue) and Ey (red) in the SRF frame. (b) Hodograms Ey(Ez) calculated within equidistant time windows of 0.7 ms. (c), (d) Wavelet spectrograms of the electric energy ∣E(f, t)∣2 in the high- and low-frequency ranges, i.e., 52 ≤ f ≤ 53.8 kHz and f ≤ 0.7 kHz, respectively. (e) Wavelet spectrogram of the magnetic energy ∣B(f, t)∣2, in the same frequency range as (c). (c)-(e) The color bars are in logarithmic scales. (f)–(i) Power spectra of Ez (blue), Ey (red), and cB (green), respectively. Zoomed-in views are presented, in linear scales, in the ranges of 52 ≤ f ≤ 53.8 kHz (g), (h) and f ≤ 0.7 kHz (i). (h), (i) Linear scales; the black curve represents the spectrum of ∣E∣2. The dashed vertical lines correspond to peaks at ﹩{f}_{2}\simeq 52.86﹩ kHz and f1 ≃ 53.05 kHz (g), (h), and at ﹩{f}_{1}^{{\prime} }\simeq 0.18﹩ kHz (i). Spectra in (f)–(i) are calculated in the time interval of 0 ≤ t ≤ 62 ms.
Other Images in This Article
Copyright and Terms & Conditions
© 2026. The Author(s). Published by the American Astronomical Society.