Image Details
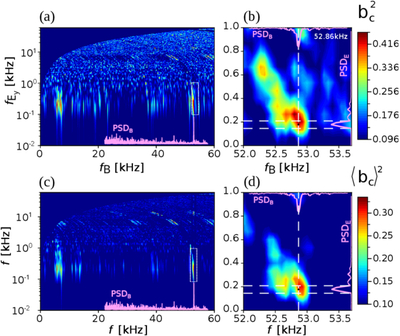
Caption: Figure 4.
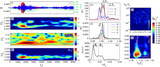
Determination of the phase coherence between waves using cross-bicoherence. (a) Square of the cross-bicoherence, ﹩{b}_{c}^{2}({f}_{B},{f}_{{E}_{y}})﹩, calculated with the field triad (B, Ey, Ey) over the time interval of 0 ≤ t ≤ 62 ms (see Equation (1) and the text), in the frequency range of ﹩{f}_{B},{f}_{{E}_{y}}\,\leqslant \,60﹩ kHz. (b) Zoom-in of (a) in the domain 52 ≤ fB ≤ 53.8 kHz and ﹩{f}_{{E}_{y}}\,\leqslant \,1﹩ kHz, with bc ≃ 0.65 at ﹩({f}_{B},{f}_{{E}_{y}})=({f}_{{ \mathcal Z }},{f}_{{ \mathcal S }})\simeq (52.86,0.18)﹩ kHz (black dot). (c) Square of the cross-bicoherence averaged over the 18 triads with Ey or Ez in the second position, ﹩{\langle {b}_{c}\rangle }^{2}﹩, in the same frequency range as (a). (d) Zoom-in of (c), in the same frequency domain as (b), where ﹩\langle {b}_{c}\rangle \simeq 0.55﹩ at ﹩({f}_{{ \mathcal Z }},{f}_{{ \mathcal S }})﹩ (black dot). (b), (d) The dashed white vertical line indicates the local plasma frequency. The magenta curves represented on the upper and right borders of the panel reproduce the high- and the low-frequency spectra used to calculate bc, respectively (see Figures 3(h), (i)).
Other Images in This Article
Copyright and Terms & Conditions
© 2026. The Author(s). Published by the American Astronomical Society.