Image Details
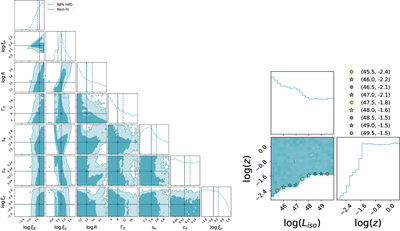
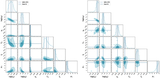
Caption: Figure 4.
Left: confidence contours of the joint spectral fitting parameters for the prompt phase. Crossing points indicate the medians of the post-burn-in MCMC samples, while dashed lines mark the 1σ HPD interval of the marginalized 1D posterior distribution; values and priors are provided in Table 1. Right: parameter space of isotropic gamma-ray luminosity (Lγ,iso) and redshift (z) consistent with Fermi-LAT upper limits under GRB 100316D configuration. Markers represent parameter points along the 95% confidence level boundary used to illustrate the predicted flux in Figure 3. Coordinates for these boundary samples are provided in the legend in the upper-right panel.
Other Images in This Article
Copyright and Terms & Conditions
© 2026. The Author(s). Published by the American Astronomical Society.