Image Details
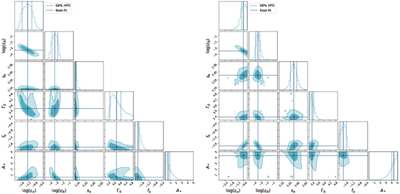
Caption: Figure 5.
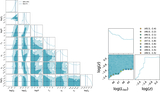
Confidence contours of the spectral fitting parameters for GRB 060218 (left) and GRB 100316D (right). Solid lines indicate the medians of the post-burn-in MCMC samples, while dashed lines mark the 1σ HPD interval of the marginalized 1D posterior distribution; values and priors are provided in Table 2.
Other Images in This Article
Copyright and Terms & Conditions
© 2026. The Author(s). Published by the American Astronomical Society.
Copyright ©
2026 Astronomy Image Explorer. All Rights Reserved.