Image Details
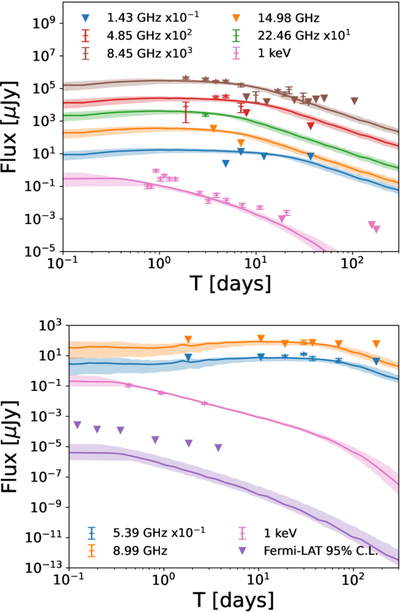
Caption: Figure 1.
Multiwavelength afterglow lightcurves for GRB 060218 (top) and GRB 100316D (bottom). Solid lines represent the posterior median of the FS model prediction, with 1σ uncertainties (shaded), compared against observations (crosses) with 1σ error bars or 95% confidence level upper limits (triangles). The Fermi-LAT upper limit is evaluated at 1 GeV.
Other Images in This Article
Copyright and Terms & Conditions
© 2026. The Author(s). Published by the American Astronomical Society.
Copyright ©
2026 Astronomy Image Explorer. All Rights Reserved.